Why React needs a key prop
Why can't React just magically know what to do without a key?

Kent C. Dodds
When was the last time you tried your app out on the kinds of devices your end users are using? If you haven't, have you at least tried to simulate the kind of performance characteristics of your users on low-end devices?
Or are you working on a product that only users with high-end devices use? You've got metrics to prove that only high-end device users are using your app do you? Hmmm... Have you considered that the reason low-end device users aren't using your app because when they show up to your app they never come back because performance is bad? That might make an impact on your metrics a bit 😅
If you have profiled your app, are you sure you're doing it correctly?
Check this out:
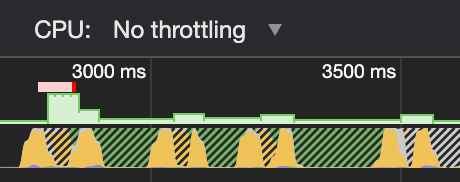
If you don't recognize where that's coming from, it's a screenshot of the Chrome DevTool's Performance tab.
Here's the interaction that I'm doing that's creating that flamegraph:

From that flamegraph, we can see that there are maybe two spots that could use some optimization. But oh, what's that? It says "CPU: No throttling." Remember that our users might not have the high speed devices that we use to create our applications. If we want to make sure our apps work for users with less powerful machines, then we should at least simulate those kinds of machines. So let's change that to throttle our CPU by 6x:
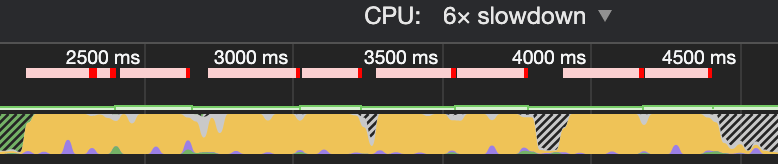
Yikes!!! Look at those red lines! That's some slow janky stuff there folks. How in the world could users possibly use this app with anything but a souped up beast of a machine! React must be SO SLOW!
No hold on. Take a step back. Take a deep breath. Step away from the window and put your laptop down. It's really important that I tell you something about React performance.
You know all those helpful warnings that React gives you when you do something wrong? Stuff like:
Element type is invalid: expected a string (for built-in components) or a class/function (for composite components) but got: undefined.
This is one of the things that I loved about React when I started using it. I was so used to things silently failing and having to dig around to figure out what I did wrong.
Turns out, React has to do quite a bit of extra work to make that magic happen. That doesn't come for free. In fact, it's actually pretty impactful. But we don't need these in production, so our end-user should never run that extra code. Luckily, React has been built with this in mind and the process to get rid of this extra code is well documented.
So let's try that:
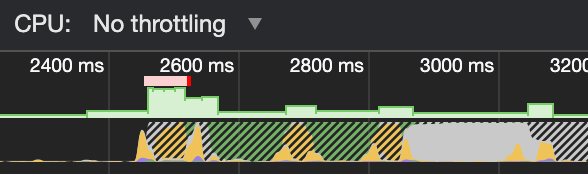
Phew! That's much better! We have a much better idea of what is actually slow. But oh, let's not forget to throttle things to simulate our lower-end device user's experience:
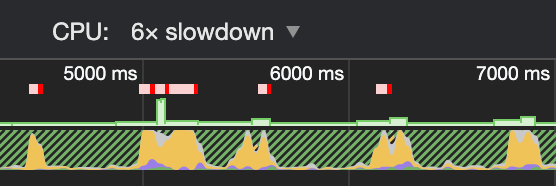
Ok, so it looks like we've got a few things to improve for our lower-end device users.
If you're not measuring what your user's actual experience is like, then you could spend all your time chasing the optimization of red herring distractions and miss the actual interactions that cause your users grief.
Actually profiling your app's performance is just a first step, properly profiling it is the next. But hold up... I'm just simulating the user's experience on my own device. So I'm only close to the user's experience, but do I really know for sure what it's like for users? And what about regressions? Do you expect me to do that every time I make a code change? No thank you.
This is why production performance monitoring is so important. We should keep track of how things are performing for users. Luckily React also exposes the ability to do this, so we can batch up information about every mount and update of components as the user's using them and we can send that information off to our backend, like this:
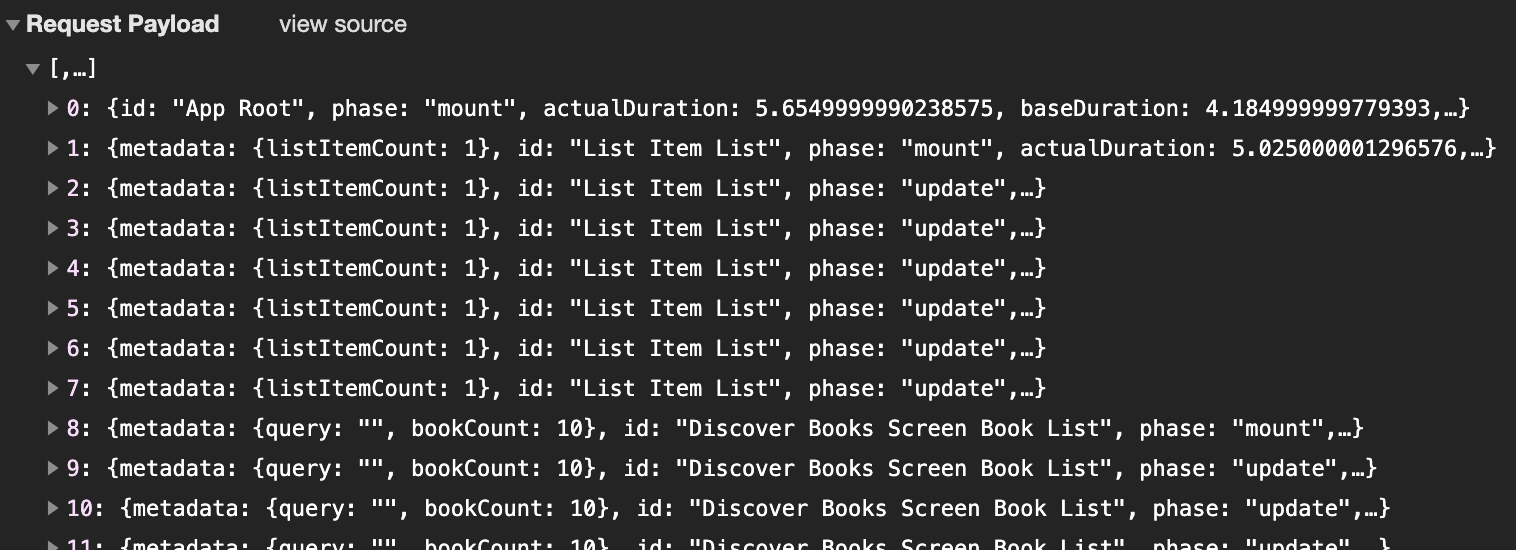
Then we can store that in a time-series database, and get alerts and graphs based on that. Companies like Facebook enable this for a fraction of their users and they can automatically rollback changes if they result in performance problems.
Buttery-smooth performance is one of the things users expect from our apps and if we don't have that, they lose trust in our app. They may endure the janky experience, or they may abandon it altogether. It's often not the kind of thing user's will complain about, so if you're not testing and monitoring it, then you may never know that you're missing out on making your app available to those users at all. And if you don't do that properly, then you can spend your days optimizing the wrong things and in the wrong ways.
And yes, I've got lots to teach you about in EpicReact.Dev.
P.S. Have you ever tried to pop open the React Profiler tab in production and seen this:
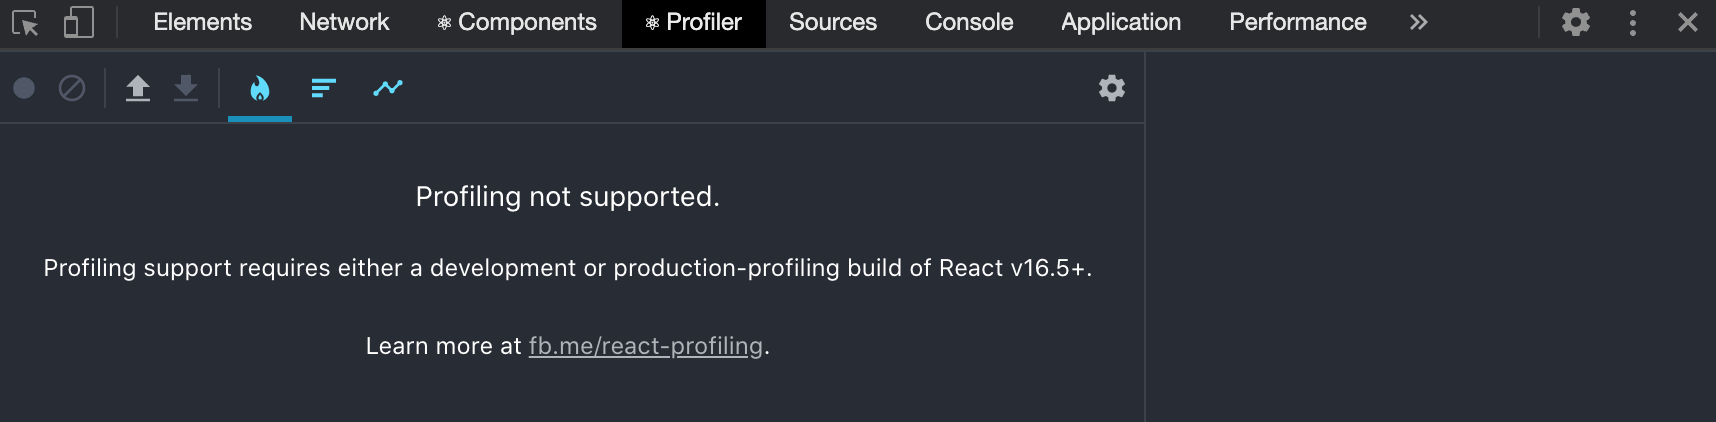
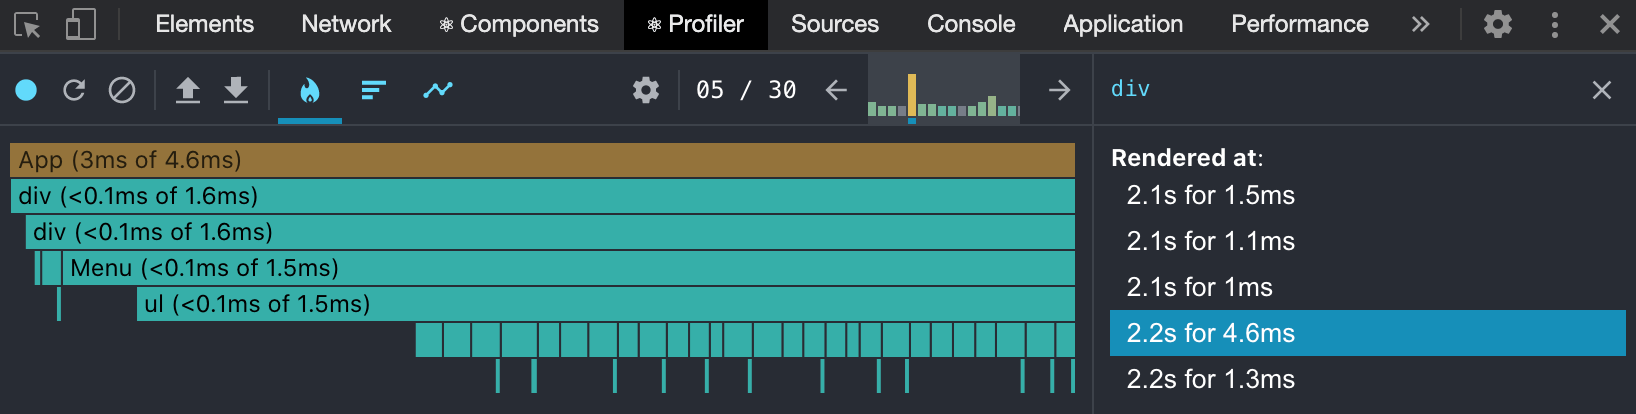
In EpicReact.Dev, I'll show you how to use the Profiler tab in production:
Delivered straight to your inbox.
Why can't React just magically know what to do without a key?
Understanding server-side waterfalls with RSCs and client-side waterfalls we're familiar with and why server-side waterfalls are probably better.
How web app architecture evolved from full page reloads to React Server Components, and why each step in this journey mattered for developers and users.
How React's new model lets you build interactive, data-rich UIs without the pain of old-school script tags and prop drilling.